
Debug JavaScript with Browser DevTools Breakpoints
That is the worst kind of bug for a beginner, because the console gives you nothing to read. So you start adding console.log() lines, reloading, guessing,…

Key topics
Your script runs. No red errors. And the total is still wrong.
That is the worst kind of bug for a beginner, because the console gives you nothing to read. So you start adding console.log() lines, reloading, guessing, and adding more. Ten minutes later you have six log statements and no answer.
A breakpoint ends the guessing. It freezes your program mid-run and lets you look at every value inside it — not just the ones you thought to print. Learning to debug JavaScript with breakpoints is the moment debugging stops being a guessing game and becomes an investigation.
Why a Breakpoint Beats Another console.log
A breakpoint is a marker you place on a line of code. It tells the browser: stop right before this line runs, and wait for me.
That pause is the whole point. When the program is frozen, you can see the real state of everything — every variable in the current function, the chain of function calls that got you here, and the exact line about to execute.
Compare that to console.log(). Logging shows you only the values you remembered to print, at the moments you decided to print them. If the bug lives in a variable you never thought about, your logs will never mention it. A paused program shows you everything at once.
There is a second advantage that matters more than beginners expect: you do not need to know where the bug is. With logging, you have to guess a location, insert a line, and reload. With a breakpoint, you pause near the suspect area and walk forward one line at a time until a value goes wrong. The bug reveals its own location.
You already know how to run a script and read console output. This is the next step for when output alone is not enough.
Open DevTools and Find Your File
Open your page in the browser, then open DevTools:
- Press F12, or right-click anywhere on the page and choose Inspect.
- In Chrome or Edge, click the Sources tab. In Firefox, click the Debugger tab. They do the same job under different names.
You will see three areas:
- The file tree on the left — every file the page loaded.
- The code editor in the middle — the contents of whichever file you select.
- The debugger panel on the right — Breakpoints, Scope, Call Stack, and Watch.
Click your script file in the tree. If your JavaScript is written inline inside the HTML, it still appears — look for the page file itself and select it.
Note: If the debugger panel is missing, your DevTools window may be too narrow. Widen it, or look for the collapsible sections at the bottom of the panel.
Set a Breakpoint and Pause the Program
Here is a small script with a bug in it. Save it as app.js and load it from an HTML page:
function addNumbers(a, b) {
  const total = a - b;
  return total;
}

const result = addNumbers(5, 3);
console.log("Result:", result);
Result: 2
The script runs cleanly. It also prints 2 when you expected 8. Nothing crashed, so the console has no error to show you.
Now find the line const total = a - b; in the Sources panel and click the line number in the gutter to the left of the code. A blue or highlighted marker appears. That is your breakpoint.
Reload the page with Ctrl+R (Windows/Linux) or Cmd+R (Mac).
The page freezes. The line you marked is highlighted, and the right-hand panel fills with information.
Common mistake: Execution stops before the marked line runs, not after. Beginners stare at the highlighted line assuming it already executed. It has not. The values you see are the state just before that line does its work.
Knowledge check
Check your understanding
Answer this question before you continue.
Read the Scope Panel to Inspect Variables
With the program paused, look at the Scope panel on the right. This is where you inspect variables in browser DevTools, and it is where most beginner bugs get caught.
Scope is organized into sections:
- Local — variables inside the function you are currently paused in. This is where you should look first.
- Closure — variables from an outer function that this function can still see.
- Global — variables available everywhere on the page.
In our example, Local shows a and b. Expand it and you will see a: 5 and b: 3. Those are correct. The function received exactly what you passed in.
So the inputs are fine. That narrows the search to one line.
You can also use Watch to pin a specific expression. Click the + in the Watch panel and type a - b. The debugger evaluates it and keeps it updated as you step. This is useful when you care about one calculation and do not want to scan the whole scope list every time.
Knowledge check
Check your understanding
Answer this question before you continue.
Step Through the Function Line by Line
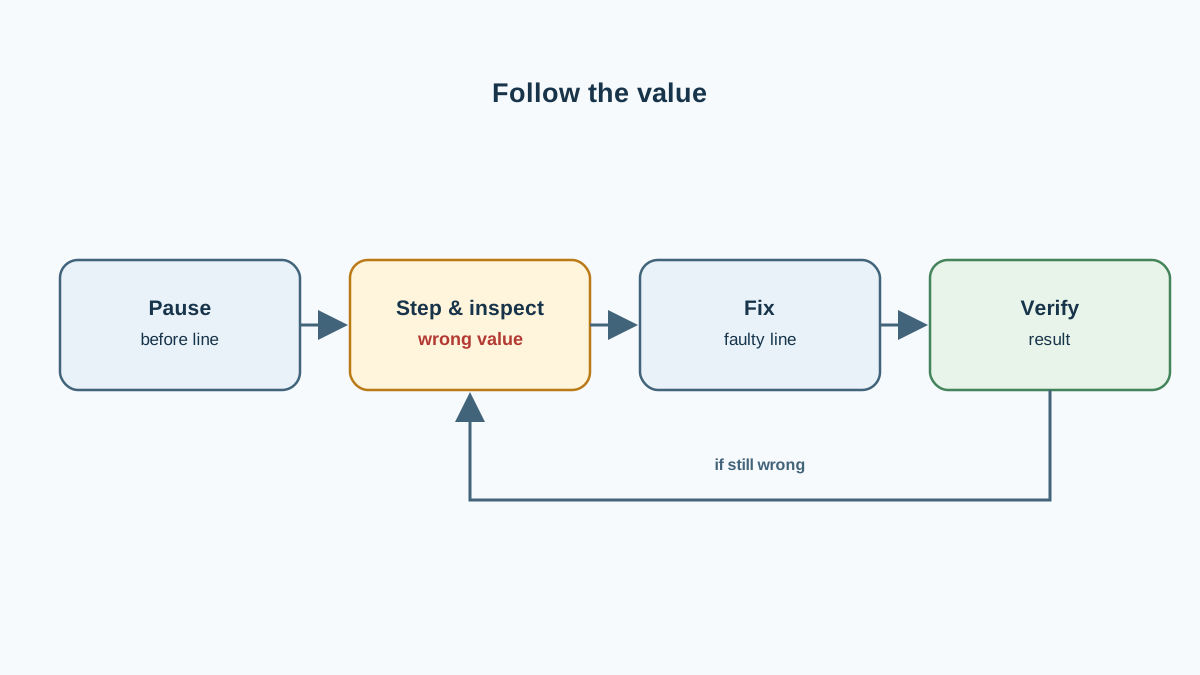
Stepping means running your code one line at a time so you can watch values change. The controls sit at the top of the debugger panel:
| Control | What it does | Use it when |
|---|---|---|
| Step over | Runs the current line, moves to the next line in the same function | Your default move — use it most of the time |
| Step into | Follows a function call down into that function's body | You suspect the bug is inside a function being called |
| Step out | Finishes the current function and returns to whoever called it | You stepped in by accident, or you trust the rest of this function |
| Resume | Continues running until the next breakpoint or the end | You are done inspecting and want the page to finish |
Start with Step over. Press it once. The line const total = a - b; executes, and the Scope panel updates. Now total appears in Local with a value of 2.
There it is. The function received 5 and 3, and produced 2. The inputs were right; the calculation was wrong. You have landed on the exact line where the value diverges from what you expected.
Notice what just happened. You did not guess. You watched the value appear, and the wrong number pointed at its own line.
Tip: If you step too far and lose your place, press Resume and reload the page. The breakpoint is still set, so you will pause in the same spot again.
Knowledge check
Check your understanding
Answer this question before you continue.
Fix the Line and Verify the Fix
Go back to your editor and change the operator:
function addNumbers(a, b) {
  const total = a + b;
  return total;
}

const result = addNumbers(5, 3);
console.log("Result:", result);
Result: 8
Before you reload, remove or disable the breakpoint. Click the line number again to toggle it off, or uncheck it in the Breakpoints panel. If you leave it on, the page will pause every single time it loads, which looks exactly like a frozen website.
Reload and check the page. The output should now read 8.
If it is still wrong, set the breakpoint again and repeat the loop. That loop — pause, step, inspect, fix, verify — is the actual skill. The first guess is not.
Knowledge check
Check your understanding
Answer this question before you continue.
Common Beginner Mistakes at the Breakpoint
Most people who decide breakpoints "do not work" hit one of these:
- Setting a breakpoint but never reloading. The script already ran. It will not run again until you reload the page or trigger the code again.
- Expecting the marked line to have executed. It pauses before that line. Always.
- Looking in the wrong scope. A variable you expect in Local may live in Closure or Global. Expand all three before concluding a value is missing.
- Leaving breakpoints enabled. Every page load will pause. Disable them when you are done.
- Forgetting the
debuggerstatement. You can also writedebugger;directly in your code to pause there. It only works while DevTools is open, and it lives in your source — so remember to delete it before you ship.
When to Use Breakpoints and When Not To
Breakpoints are not the answer to every problem. Here is the rule I use:
| Situation | Better tool |
|---|---|
| Logic runs but produces the wrong value | Breakpoint |
| You cannot tell which line is responsible | Breakpoint |
| The bug only appears on one pass of a loop or one event | Breakpoint |
| You need one value at one moment in a short script | console.log() |
| A file fails to load, or scripts run in the wrong order | Check the Network and Console panels |
| A selector never matches any element | Inspect the DOM, not the execution |
The pattern: breakpoints are for execution problems — code that runs but behaves wrongly. Setup and structure problems need different tools, and pausing execution will not help you find a missing file.
Practice: Break a Function on Purpose
The fastest way to make this stick is to create the bug yourself.
- Write a function that takes two numbers and returns their sum.
- Deliberately change one operator — swap
+for-, or change an operand. - Set a breakpoint on the first line inside the function, reload, and step through until the wrong value appears.
- Write down the value you expected and the value you observed at each step.
- Fix the line, remove the breakpoint, and confirm the output matches your expectation.
Do it twice with two different bugs. The second time, you will notice you are not nervous anymore — you are just looking.
Where to Go Next
When a script runs but produces the wrong result, stop guessing and pause it. That is the habit worth keeping.
The next natural step is applying the same stepping skills to a loop or an event handler, where the bug only shows up on one specific pass. That is where stepping stops feeling like a trick and starts feeling like a superpower: you can watch iteration five of a loop the same way you just watched a single line.
Knowledge check
Final check
Finish the article by checking the ideas you just learned.
References
Want a more structured JavaScript path?
Use the JavaScript for AI Applications Starter Pack to turn individual tutorials into a focused path from language fundamentals to interactive AI applications.
JavaScript for AI Applications Starter Pack
Build the JavaScript foundation behind modern interactive applications. The JavaScript for AI Applications Starter Pack takes you from core language concepts through functions, browser events, forms, DOM updates, application state, debugging, and practical projects—so you can learn how interfaces take input, work with structured data, respond to users, and turn results into experiences people can actually use.
- 253-page illustrated PDF
- 12 guided JavaScript chapters
- Visual concept diagrams
- Self-assessment quizzes
- Bonus deep-dive sections
- DOM, events, forms & application state
- Browser projects, debugging & practical workflows
Coming soon


