
JavaScript Browser Console Reference for Beginners
Your JavaScript ran. The page loaded. And nothing happened. No message, no result, no clue where to look next.

Key topics
Your JavaScript ran. The page loaded. And nothing happened. No message, no result, no clue where to look next.
Every JavaScript beginner hits this wall. The good news is that your browser already has the tool you need, built right in. It's called the console, and it's the fastest feedback loop in JavaScript. No setup, no files, no installs. Just type a line, press Enter, and see what your code is actually doing.
This cheatsheet shows you how to open the JavaScript browser console, run quick lines of code, inspect values, and read your first error messages without panic.
Why the Console Is Your First Debugging Tool
The console is a built-in JavaScript playground inside every major browser. Think of it as a direct line to the JavaScript engine running the page you're looking at.
When your code fails silently, the console is where the browser speaks up. It's where errors appear, where values get printed, and where you can test a single line of JavaScript without creating a file or touching your editor.
If you haven't set up your coding environment or seen how the browser runs JavaScript yet, that's fine. This guide assumes you have a browser open and a page loaded. That's all you need.
The console gives you three things you'll use every day as a beginner:
- A place to run JavaScript instantly
- A way to inspect what values your variables hold
- A window into what went wrong when code fails
Knowledge check
Check your understanding
Answer this question before you continue.
How to Open the Console
Opening the console takes about three seconds once you know the move.
The right-click method:
- Right-click anywhere on a webpage.
- Choose Inspect (or Inspect Element).
- Click the Console tab in the panel that opens.
The direct shortcut:
- Windows/Linux:
Ctrl + Shift + J - macOS:
Command + Option + J
This works in Chrome, Edge, and Firefox. Safari uses a slightly different path, but the Inspect route works there too.
Depending on your browser and version, the console may appear as a tab at the top of the developer tools panel or as a section at the bottom of your window. Either way, you're looking for a blank area with a prompt where you can type.
That blank prompt is your new workspace.
Run Your First Line of JavaScript
Type this into the console and press Enter:
2 + 2
The console immediately prints:
4
That's the whole loop. The console reads your line, evaluates it, prints the result, and loops back to wait for your next command. This is often called a read-evaluate-print loop, and it's the same interactive pattern used by many programming tools.
Try a few more:
"Hello, console!"
'Hello, console!'
let name = "Ada";
name;
'Ada'
Notice what happened there. You stored a value in a variable, then typed the variable name by itself. The console echoed back what that variable holds. That simple trick—typing a variable name to see its value—is one of the fastest ways to inspect what your code is doing.
Knowledge check
Check your understanding
Answer this question before you continue.
console.log: Your Message to the Console
Typing expressions directly into the console works great for quick checks. But when JavaScript runs from a file, it doesn't print anything on its own. That's where console.log comes in.
console.log is a method that prints a message or value to the console. You place it inside your code at the exact moment you want to see what's happening.
console.log("Hello, world!");
Hello, world!
console.log(5 + 5);
10
Why does this matter for debugging? Because console.log answers two questions that come up constantly:
- Did this line of code even run? If you don't see your log message, execution never reached that line.
- What value did this variable hold at this moment? Log the variable right before the spot where things go wrong.
let score = 0;
score = score + 10;
console.log(score);
10
That's the core debugging pattern: confirm code ran, inspect the value, move forward.
Knowledge check
Check your understanding
Answer this question before you continue.
A Small Toolkit of Console Methods
You don't need the full console API. You need a small set of methods, and you'll use one of them constantly. Each answers a different question while you debug.
console.log — "Did this run, and what's the value?"
Your everyday workhorse. Use it to confirm code ran and to inspect values. When in doubt, start here.
console.log("User clicked the button");
User clicked the button
console.warn — "Is this suspicious?"
Use this for something that looks risky but isn't broken yet. It appears with a warning icon in most browsers, so it stands out from normal messages.
console.warn("This feature is experimental");
This feature is experimental
console.error — "What actually failed?"
Use this when something went wrong. It appears with an error icon and a different color, which helps when you're scanning a busy console for the real problem.
console.error("Could not load the data");
Could not load the data
Knowledge check
Check your understanding
Answer this question before you continue.
console.clear — "Is old output getting in the way?"
When the console gets cluttered, clear it and start fresh.
console.clear();
No output here. The console just empties out.
That's the set. console.log is the one to memorize first. The other three are optional conveniences you can look up when you need them. The console has many more methods, but this small set is enough to get you through your first weeks of debugging.
Reading Your First Error Message
When your code fails, the browser doesn't stay silent. It writes an error to the console. The message might look cryptic at first, but it's actually giving you useful evidence about what went wrong.
Let's break a line on purpose. Type this into the console and press Enter:
console.log("Hello);
You'll see something like this:
Uncaught SyntaxError: Invalid or unexpected token
Here's what that means. The browser read your line and found a problem before it could even run the code. The message names the problem: a SyntaxError, which means the code broke the rules of the JavaScript language. In this case, you opened a string with a double quote but never closed it.
A common beginner error looks like this:
console.lg("Hello");
Uncaught TypeError: console.lg is not a function
Here the browser ran your code and discovered that console.lg doesn't exist. The message tells you what's wrong: you called something that isn't a function. The fix is usually a typo—console.log was the intended call.
Where the location information comes from
When you type a command directly into the console, the error may not point to a specific file and line number. The browser is evaluating your line on the spot, so there's no source file to reference.
When JavaScript runs from a saved file, the error message usually includes the file name and line number where the browser noticed the problem. That location tells you exactly where to look first in your code.
Rule of thumb: Read the first line of the error. It names the problem. Then check for a file and line reference. Look at that code before anything else.
Here's a quick scan order for your first error message:
| Look at | What it tells you | First action |
|---|---|---|
Error name (like SyntaxError or TypeError) | What kind of problem the browser found | Match it to the fix below |
| Error message | The specific detail about what went wrong | Read it for the exact issue |
| File and line reference | Where the browser noticed the problem | Open that file and find that line |
| The code at that spot | What you actually wrote | Look for typos or missing characters |
SyntaxError means the code broke the language rules before it could run. Check for missing quotes, brackets, or parentheses.
TypeError often means you called something that doesn't exist or isn't a function. Check for typos in method names like console.log.
Cryptic-looking errors become readable fast once you know what to scan for. The message names the problem. The location points to the spot. You fix the typo, reload, and move on.
Common Beginner Mistakes (and How to Recover)
Everyone hits these. Here's what happened and what to do instead.
Missing closing quote or parenthesis
console.log("Hello);
The console may wait for you to finish the line, or it may throw an error immediately. Either way, the fix is the same: close what you opened. Every " needs a matching ", and every ( needs a matching ).
Expecting console.log to appear on the page
console.log writes to the console panel, not to the webpage itself. If you want text visible on the page, you need different tools. For now, remember: console output lives in the console.
Forgetting the console runs against the current page
When you type JavaScript into the console, it runs in the context of whatever page you're viewing. That means your code can interact with that page's content, and results may depend on what that page is doing. If you test code on one site and it behaves differently on another, that's why.
The recovery move
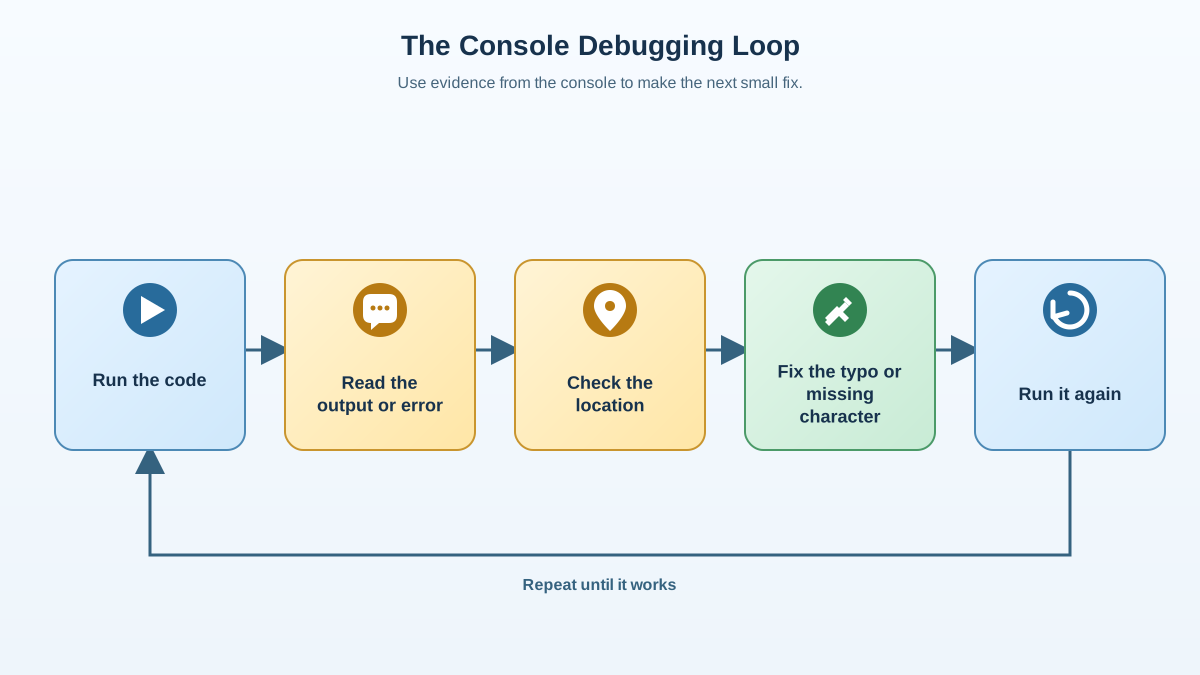
Every mistake follows the same pattern:
- Read the error message.
- Find the file and line it points to, if one is shown.
- Look at your code.
- Fix the typo or the missing character.
- Run it again.
Mistakes aren't failure. They're the browser giving you evidence about what your code is actually doing.
What to Memorize Now vs. Look Up Later
The console has far more features than a beginner needs. Here's how to divide your attention.
Memorize now:
- How to open the console
console.logfor printing values- How to read the first line of an error message
Look up later:
console.tablefor formatting arrays and objectsconsole.tracefor seeing the call stack- Utility commands like
$_(the last evaluated result) andcopy()(copy a value to your clipboard)
Two more console features are worth knowing about, even as a beginner:
History. Press the Up Arrow key to cycle through commands you've entered before. This is perfect for re-running a line after you fix a typo.
Multi-line code. Press Shift + Enter instead of Enter to add a new line without running your code yet. This lets you write small multi-line snippets directly in the console.
Your Next Step
Open the console on any page right now and run these lines:
let greeting = "I can see my code running";
console.log(greeting);
I can see my code running
Then break one line on purpose:
console.log("No closing quote);
Watch the error appear. Read the first line. Notice what it tells you.
Note: If you run the first snippet again in the same console session, you may see an error like
Uncaught SyntaxError: Identifier 'greeting' has already been declared. That's becauseletdeclarations stay in the console's memory. Press the Up Arrow, change the variable name to something new likegreeting2, and run it again.
That's the whole loop: run code, inspect values, read errors, fix mistakes. The console is where you'll practice this loop hundreds of times as you learn. It's always open, always ready, and it never judges a typo.
From here, the natural next step is writing your first real JavaScript program in a file—then using console.log inside that file to watch it run. The console you just practiced with will be your window into everything that follows.
Knowledge check
Final check
Finish the article by checking the ideas you just learned.


